Toronto Market Report Infographics
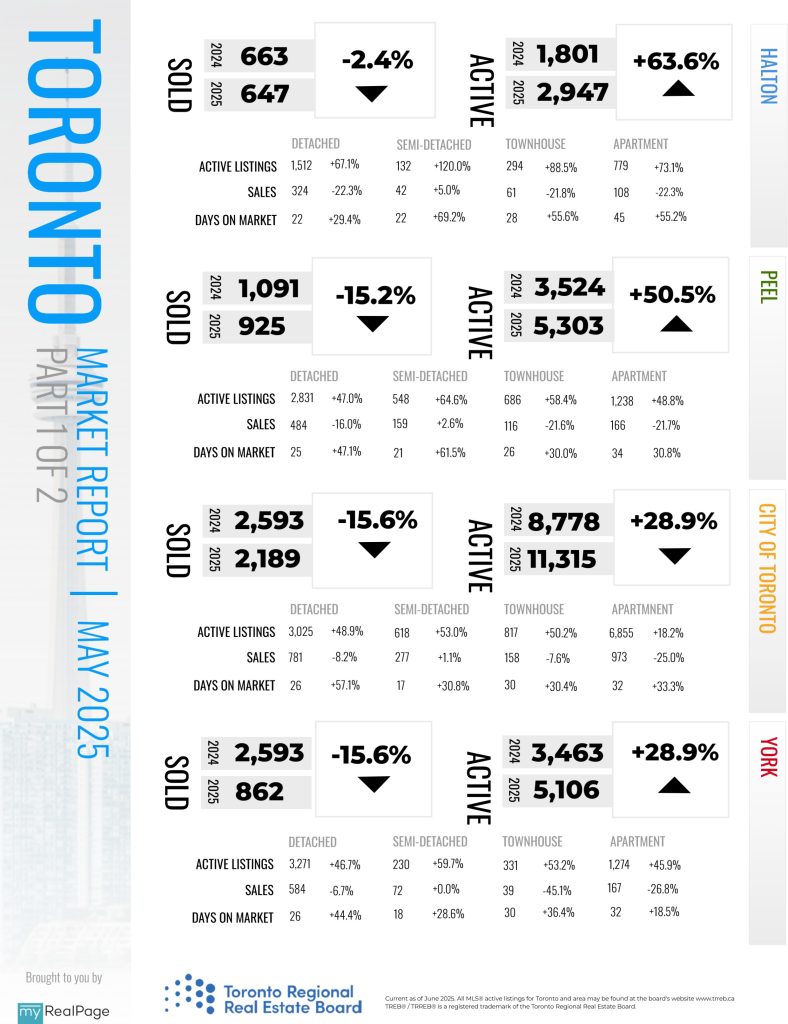
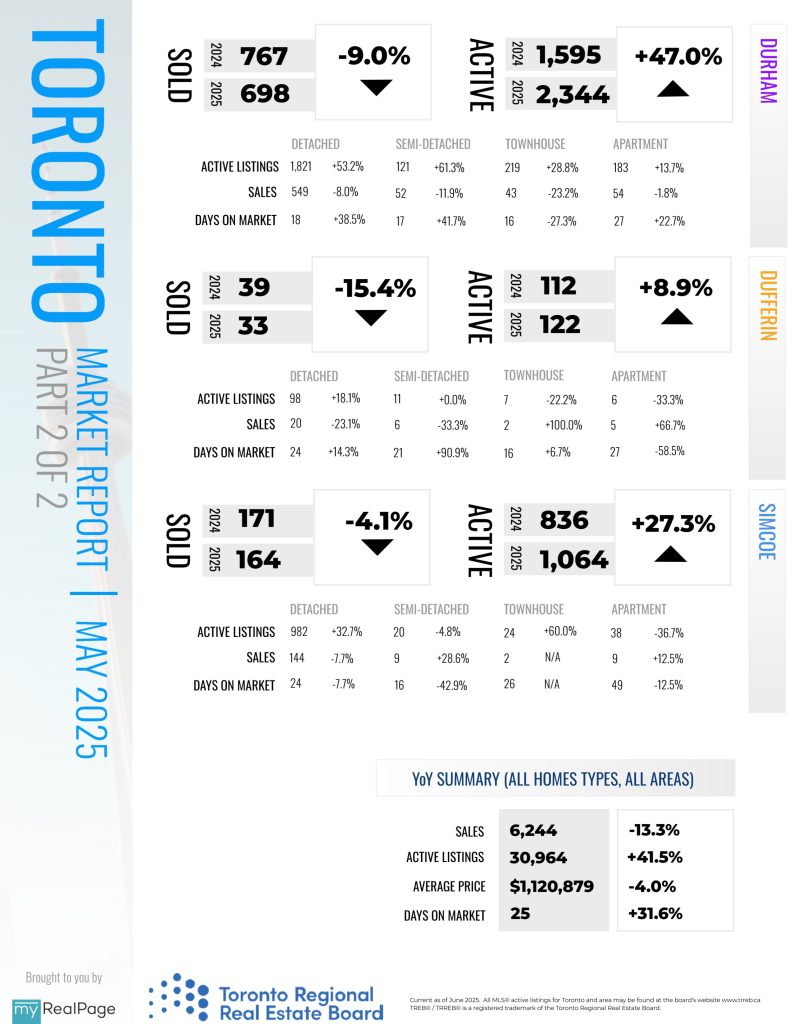
INFOGRAPHICS: May 2025 TRREB Toronto Market Reports

GTA REALTORS Release 2025 Outlook and May Stats
The Greater Toronto Area (GTA) housing market experienced an improvement in affordability in May 2025 relative to the same period a year earlier. With sales down and listings up, homebuyers took advantage of increased inventory and negotiating power.
“Looking at the GTA as a whole, homebuyers have certainly benefited from greater choice and improved affordability this year. However, each neighbourhood and market segment have their own nuances. Buyers considering a home purchase should connect with a REALTOR® who is knowledgeable about their preferred area and property type. In today’s market, working with a REALTOR® who brings expertise, the right tools, and a strong network is essential,” said Toronto Regional Real Estate Board President Elechia Barry-Sproule.
GTA REALTORS® reported 6,244 home sales through TRREB’s MLS® System in May 2025 – down by 13.3 per cent compared to May 2024. New listings entered into the MLS® System amounted to 21,819 – up by 14 per cent year-over-year.
Read the full report on TRREB website!
The following data is a comparison between May 2025 and May 2024 numbers, and is current as of June of 2025. For last month’s numbers, check out our previous infographic!
Or follow this link for all our TREB / TRREB Infographics!
Download Printable Version – May 2025 TRREB, Toronto Market Report
INFOGRAPHICS: April 2025 TRREB Toronto Market Reports

GTA REALTORS Release 2025 Outlook and April Stats
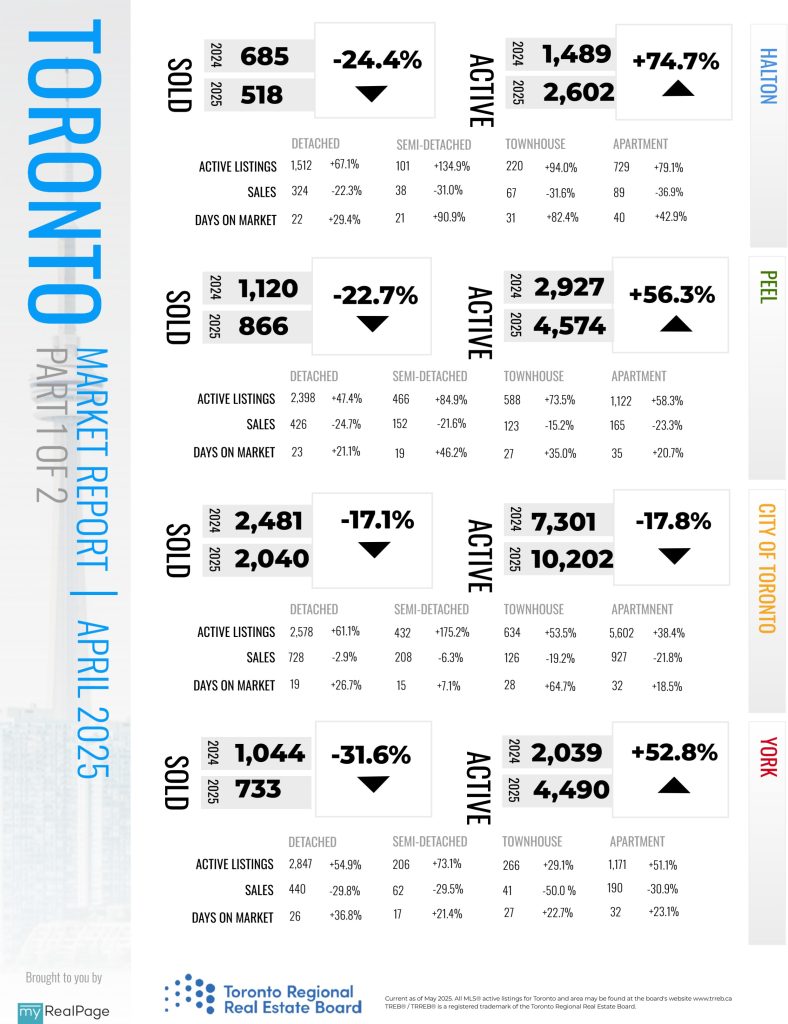
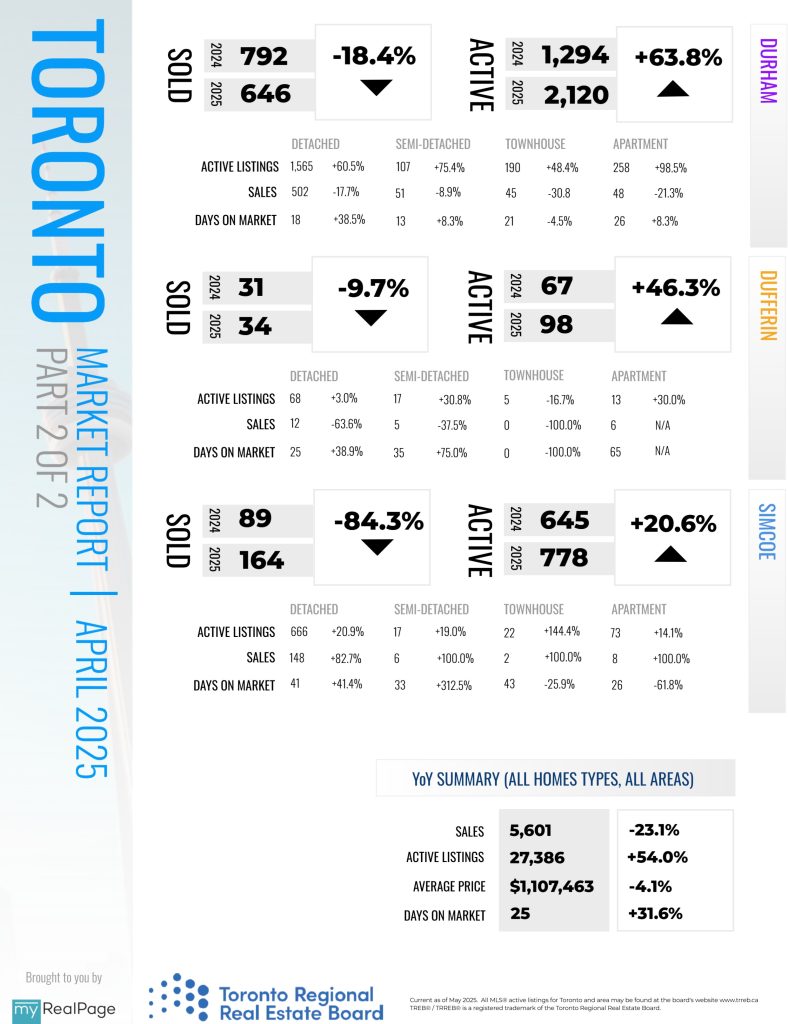
April home sales followed the regular seasonal trend with an increase relative to March. However, total residential transactions in the Greater Toronto Area (GTA) were down compared to the same time last year, as potential buyers continue to wait for lower borrowing costs and for certainty about the trajectory of the economy.
“Following the recent federal election, many households across the GTA are closely monitoring the evolution of our trade relationship with the United States. If this relationship moves in a positive direction, we could see an uptick in transactions driven by improved consumer confidence and a market that is both more affordable and better supplied,” said TRREB President Elechia Barry-Sproule.
GTA REALTORS® reported 5,601 home sales through TRREB’s MLS® System in April 2025 – down by 23.3 per cent compared to April 2024. New listings in the MLS® System amounted to 18,836– up by 8.1 per cent year-over-year. On a seasonally adjusted basis, April home sales edged up month-over-month compared to March 2025.
Read the full report on TRREB website!
The following data is a comparison between April 2025 and April 2024 numbers, and is current as of May of 2025. For last month’s numbers, check out our previous infographic!
Or follow this link for all our TREB / TRREB Infographics!
Download Printable Version – April 2025 TRREB, Toronto Market Report
INFOGRAPHICS: March 2025 TRREB Toronto Market Reports

GTA REALTORS Release 2025 Outlook and March Stats
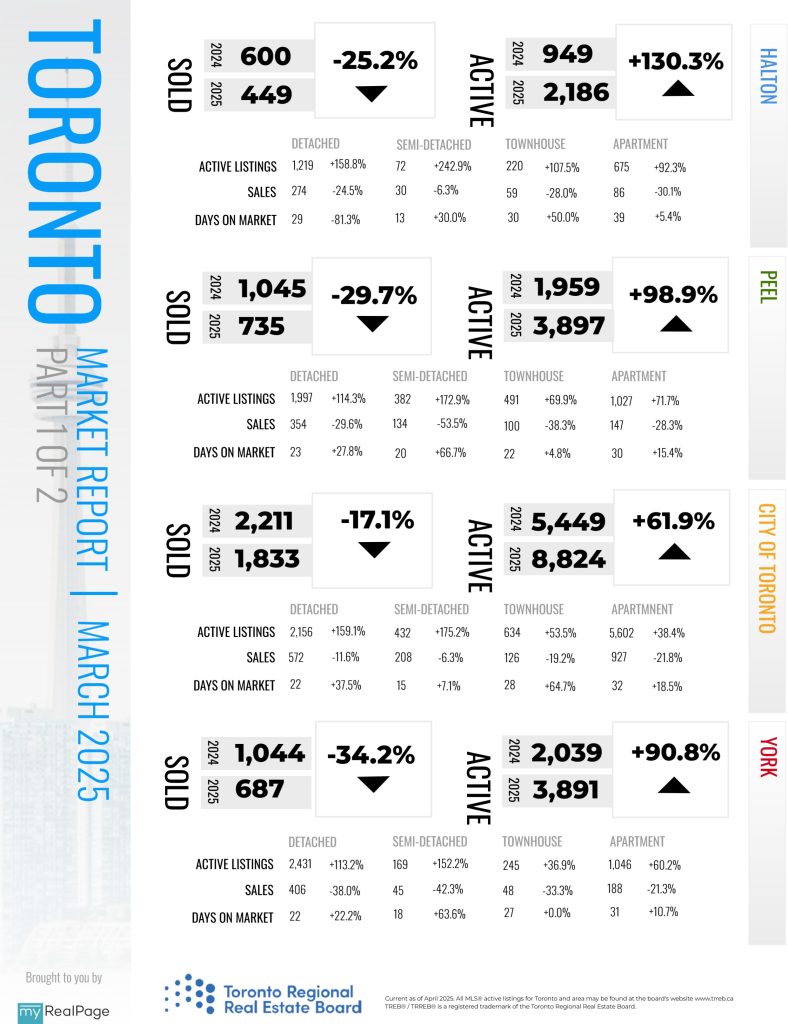
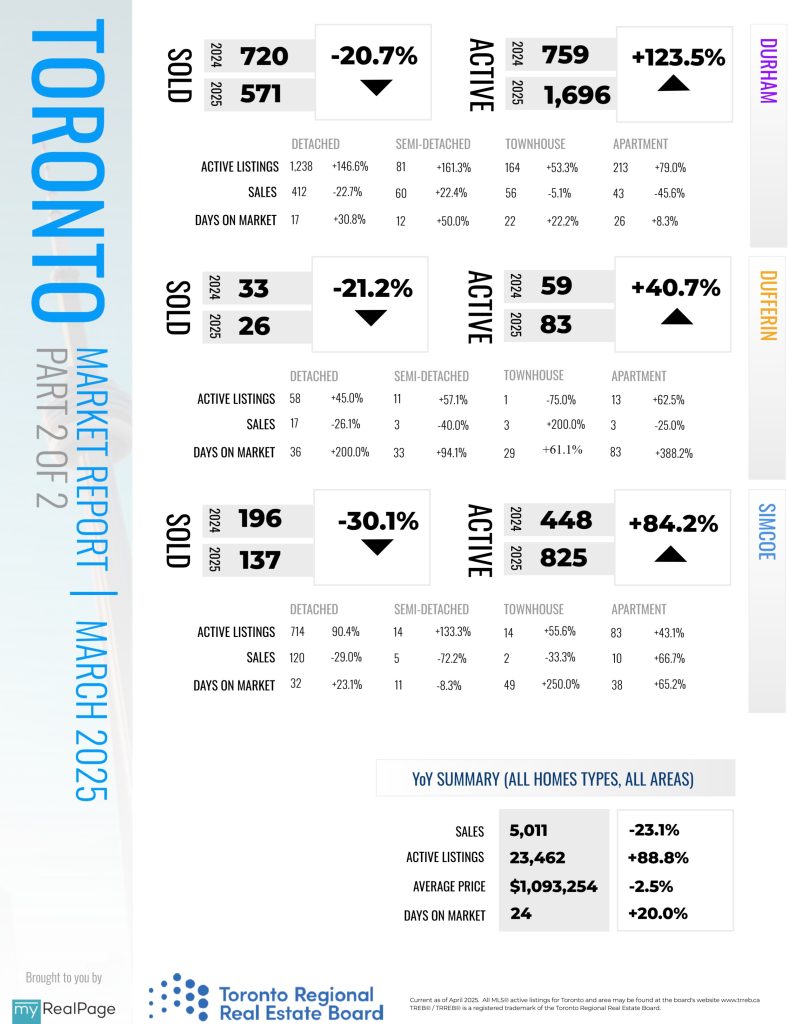
Homeownership in the Greater Toronto Area (GTA) became more affordable in March 2025 compared to the previous year. On average, both borrowing costs and home prices have declined over the past year, making monthly payments more manageable for households looking to buy a home.
“Homeownership has become more affordable over the past 12 months, and we expect further rate cuts this spring. Buyers will also benefit from increased choice, giving them greater negotiating power. Once consumers feel confident in the economy and their job security, home buying activity should improve,” said Toronto Regional Real Estate Board (TRREB) President Elechia Barry-Sproule.
“Given the current trade uncertainty and the upcoming federal election, many households are likely taking a wait-and-see approach to home buying. If trade issues are solved or public policy choices help mitigate the impact of tariffs, home sales will likely increase. Home buyers need to feel their employment situation is solid before committing to monthly mortgage payments over the long term,” said TRREB’s Chief Information Officer Jason Mercer
Read the full report on TRREB website!
The following data is a comparison between March 2025 and March 2024 numbers, and is current as of April of 2025. For last month’s numbers, check out our previous infographic!
Or follow this link for all our TREB / TRREB Infographics!
Download Printable Version – March 2025 TRREB, Toronto Market Report
INFOGRAPHICS: February 2025 TRREB Toronto Market Reports

GTA REALTORS Release 2025 Outlook and January Stats
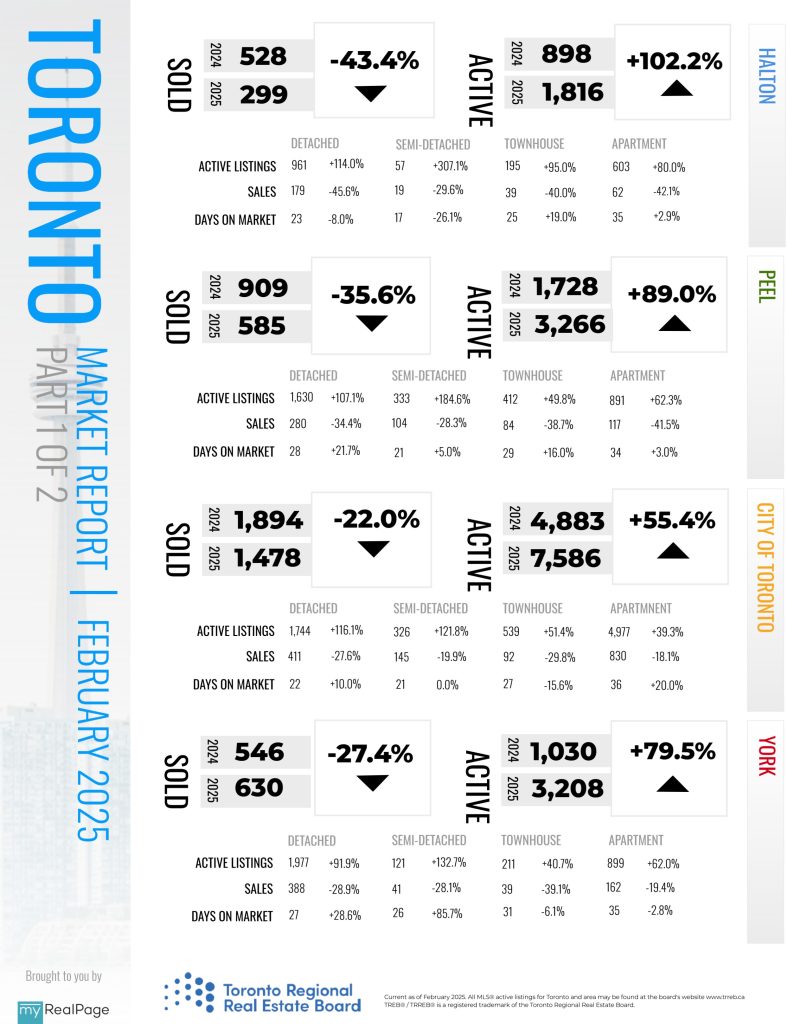
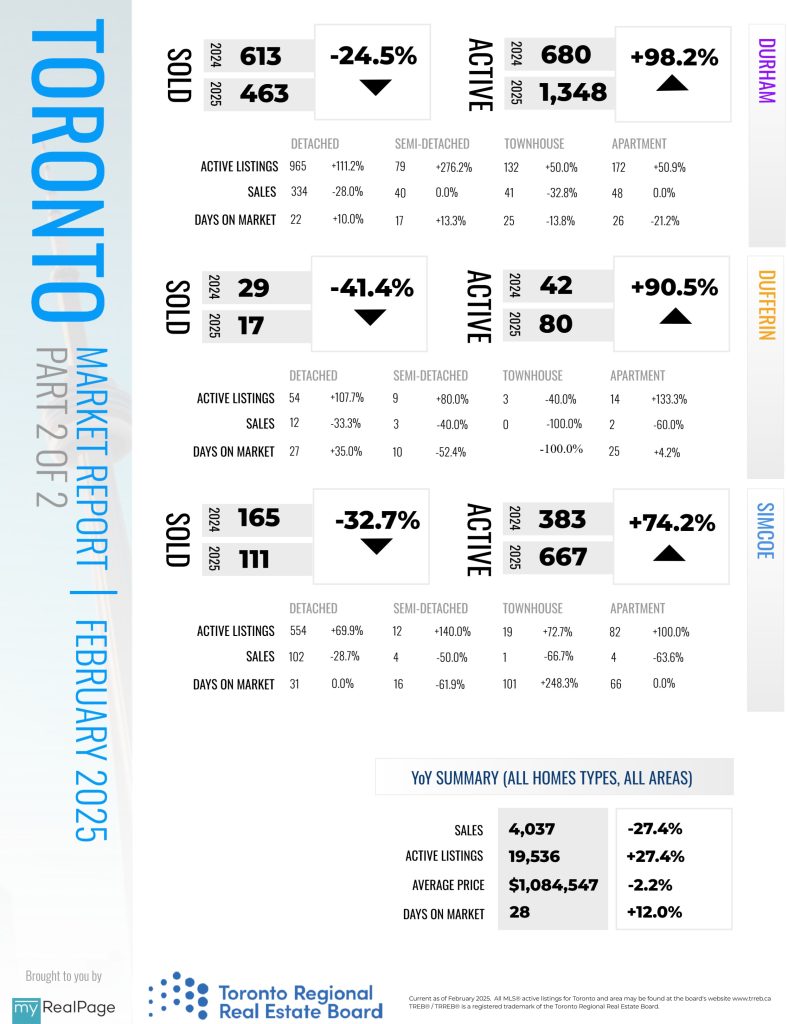
Home buyers continued to benefit from substantial choice in the Greater Toronto Area (GTA) resale market in February 2025. Home sales last month were down in
comparison to the same period last year, while listing inventory remained high, providing substantial negotiating power for homebuyers.
“Many households in the GTA are eager to purchase a home, but current mortgage rates make it difficult for the average household income to comfortably cover monthly payments on a typical property. Fortunately, we anticipate a decline in borrowing costs in the coming months, which should improve affordability,” said TRREB President Elechia Barry-Sproule.
“On top of lingering affordability concerns, home buyers have arguably become less confident in the economy. Uncertainty about our trade relationship with the United States has likely prompted some households to take a wait and see attitude towards buying a home. If trade uncertainty is alleviated and borrowing costs continue to trend lower, we could see much stronger home sales activity in the second half of this year,” said TRREB Chief Market Analyst Jason Mercer.
Read the full report on TRREB website!
The following data is a comparison between February 2025 and February 2024 numbers, and is current as of March of 2025. For last month’s numbers, check out our previous infographic!
Or follow this link for all our TREB / TRREB Infographics!
Download Printable Version – February 2025 TRREB, Toronto Market Report
INFOGRAPHICS: January 2025 TRREB Toronto Market Reports

GTA REALTORS Release 2025 Outlook and January Stats
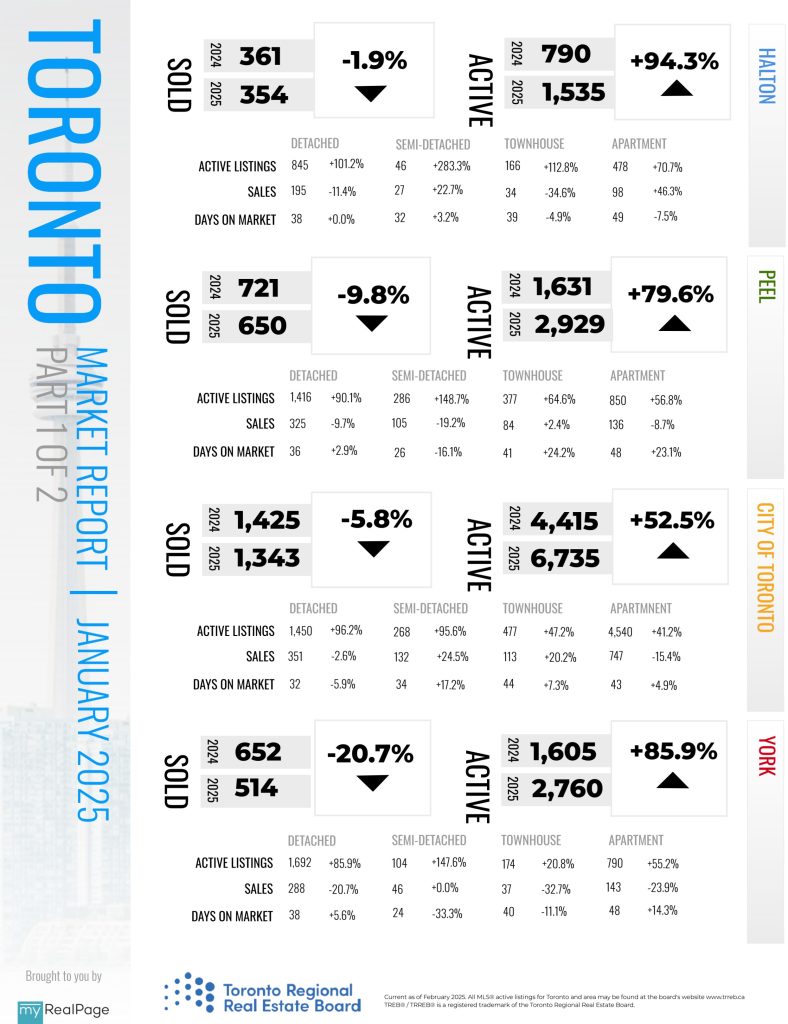
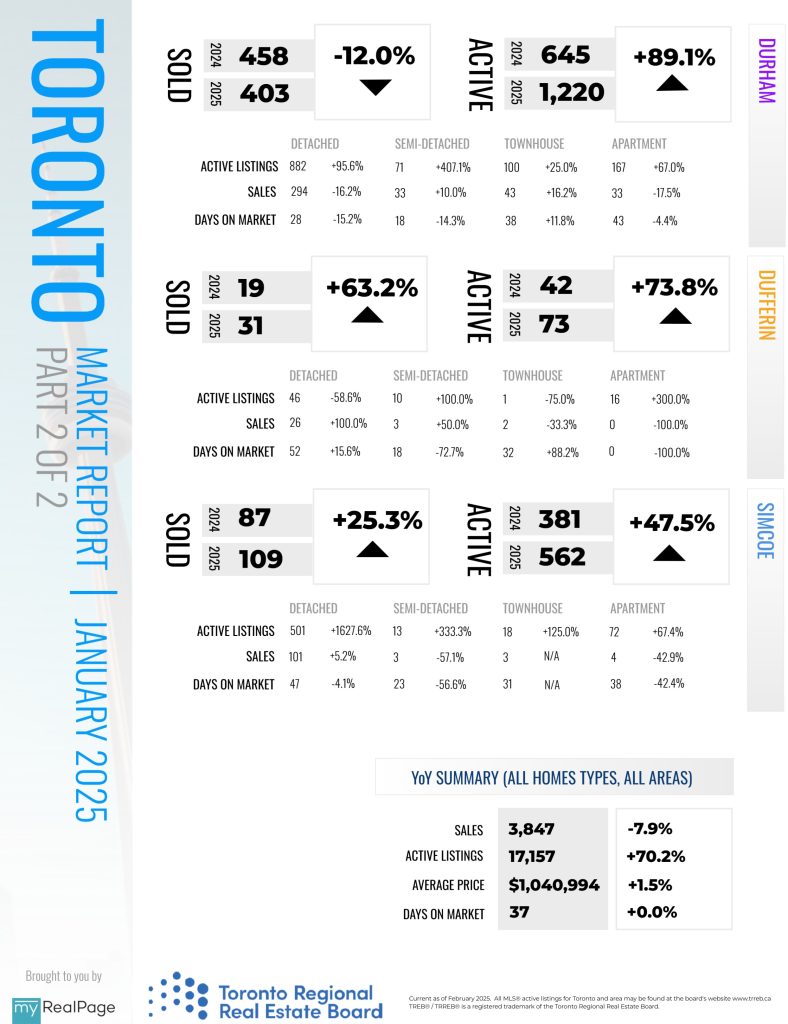
The Toronto Regional Real Estate Board’s (TRREB) Market Outlook and Year in Review report reveals that a well-supplied housing market will keep average annual home price growth at the rate inflation, with the average selling price increasing moderately in the Greater Toronto Area (GTA) over the course of the year.
“A growing number of homebuyers will take advantage of lower borrowing costs as we move toward the 2025 spring market, resulting in increased transactions and a moderate uptick in average selling prices in 2025. However, the positive impact of lower mortgage rates could be reduced, at least temporarily, by the negative impact of trade disruptions on the economy and consumer confidence,” said TRREB Chief Market Analyst Jason Mercer.
Read the full report on TRREB website!
The following data is a comparison between January 2025 and January 2024 numbers, and is current as of February of 2025. For last month’s numbers, check out our previous infographic!
Or follow this link for all our TREB / TRREB Infographics!
Download Printable Version – January 2025 TRREB, Toronto Market Report
INFOGRAPHICS: December 2024 TRREB Toronto Market Reports

GTA REALTORS® Release December Stats
The Greater Toronto Area (GTA) housing market experienced a transitionary year in 2024. Annual sales were up slightly compared to 2023, and new listings were up significantly year-over-year. Buyers benefited from substantial negotiating power on price, especially in the condominium apartment market. Average selling prices in 2024 dipped in comparison to 2023 as a result.
“Borrowing costs were top of mind for home buyers in 2024. High interest rates presented significant affordability hurdles and kept home sales well below the norm. The housing market did benefit from substantial Bank of Canada rate cuts in the second half of the year, including two large back-to-back reductions. All else being equal, further rate cuts in 2025 and home prices remaining below their historic peaks should result in improved market conditions over the next 12 months,” said the Toronto Regional Real Estate Board (TRREB) President Elechia Barry-Sproule.
Annual 2024 home sales amounted to 67,610 – up by 2.6 per cent from 65,877 sales in 2023. New listings, at 166,121, were up by a greater annual rate of 16.4 per cent. Listings increasing by a greater rate than sales provided buyers with considerable choice in the marketplace, which effectively kept a ceiling on any widespread price growth.
Read the full report on TRREB website!
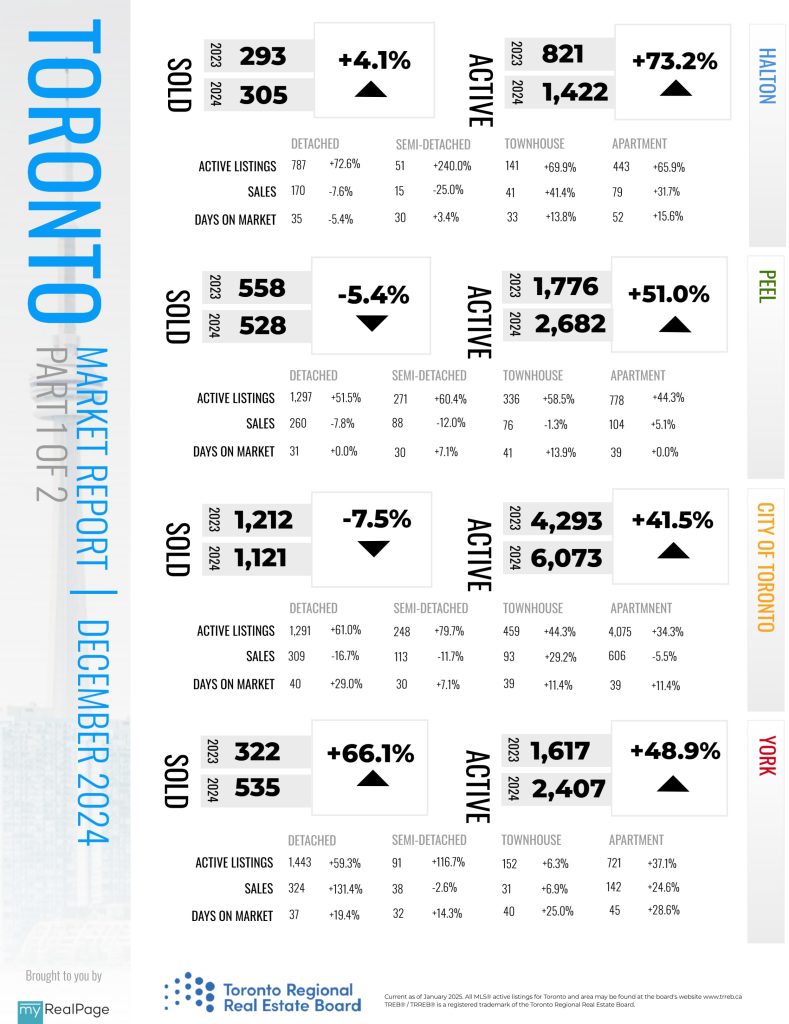
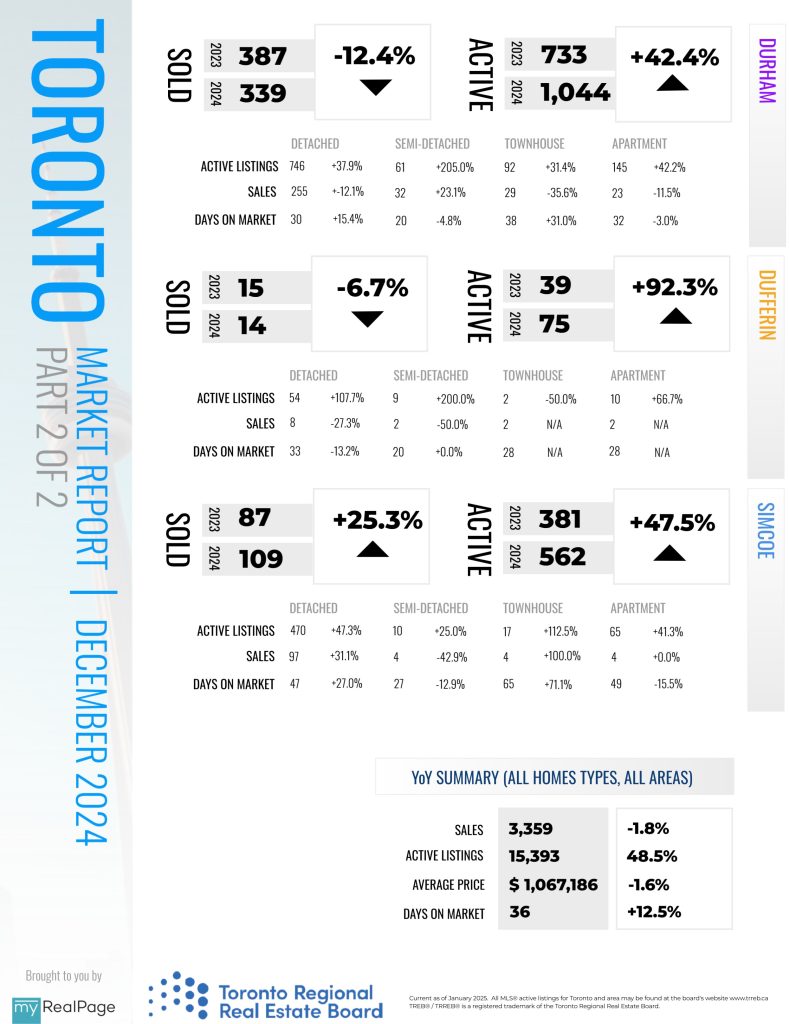
The following data is a comparison between December 2024 and December 2023 numbers, and is current as of January of 2025. For last month’s numbers, check out our previous infographic!
Or follow this link for all our TREB / TRREB Infographics!
Download Printable Version – December 2024 TRREB, Toronto Market Report
INFOGRAPHICS: November 2024 TRREB Toronto Market Reports

GTA REALTORS® Release November Stats
Greater Toronto Area (GTA) home sales increased strongly on a yearover-year basis in November 2024. Many buyers benefitted from more affordable market conditions brought about by lower borrowing costs. New listings were also up compared to November 2023, but by a much lesser annual rate.
This meant that market conditions tightened, resulting in overall average price growth compared to last year.
“As we approach the end of 2024, I am pleased to report an improvement in housing market conditions. Many home buyers patiently waited on the sidelines for reduced inflation and lower borrowing costs. With selling prices remaining well off their historic peak and monthly mortgage payments trending lower, the stage is set for an accelerating market recovery in 2025,” said Toronto Regional Real Estate Board (TRREB) President Jennifer Pearce.
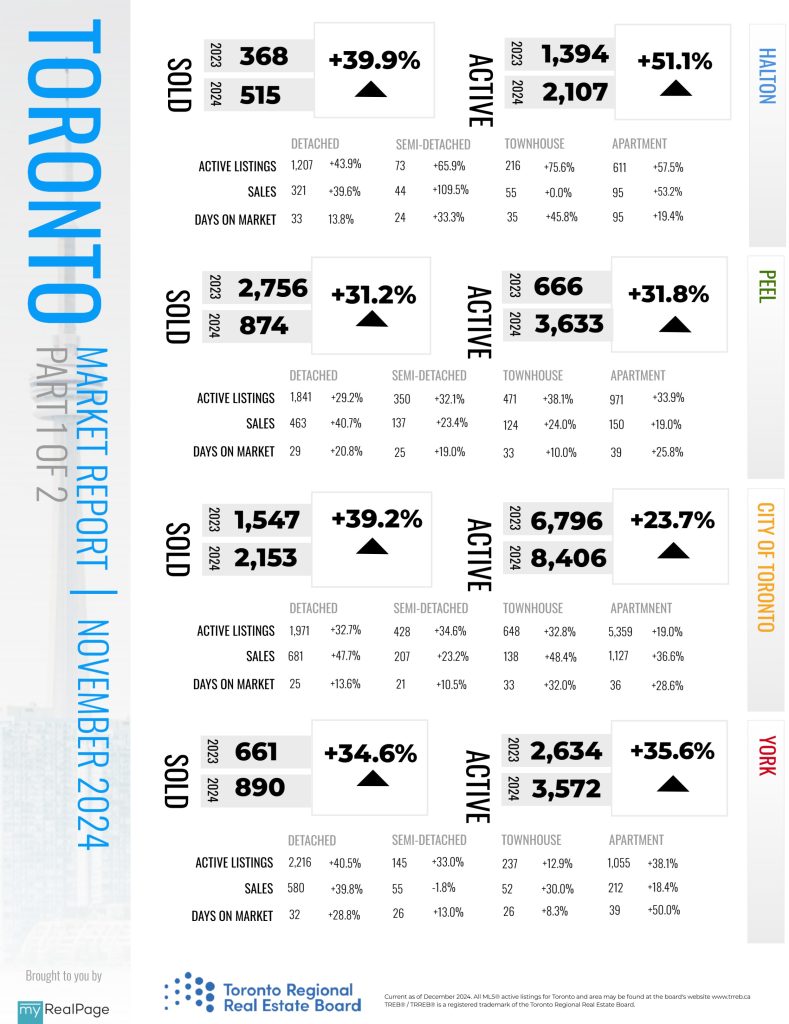
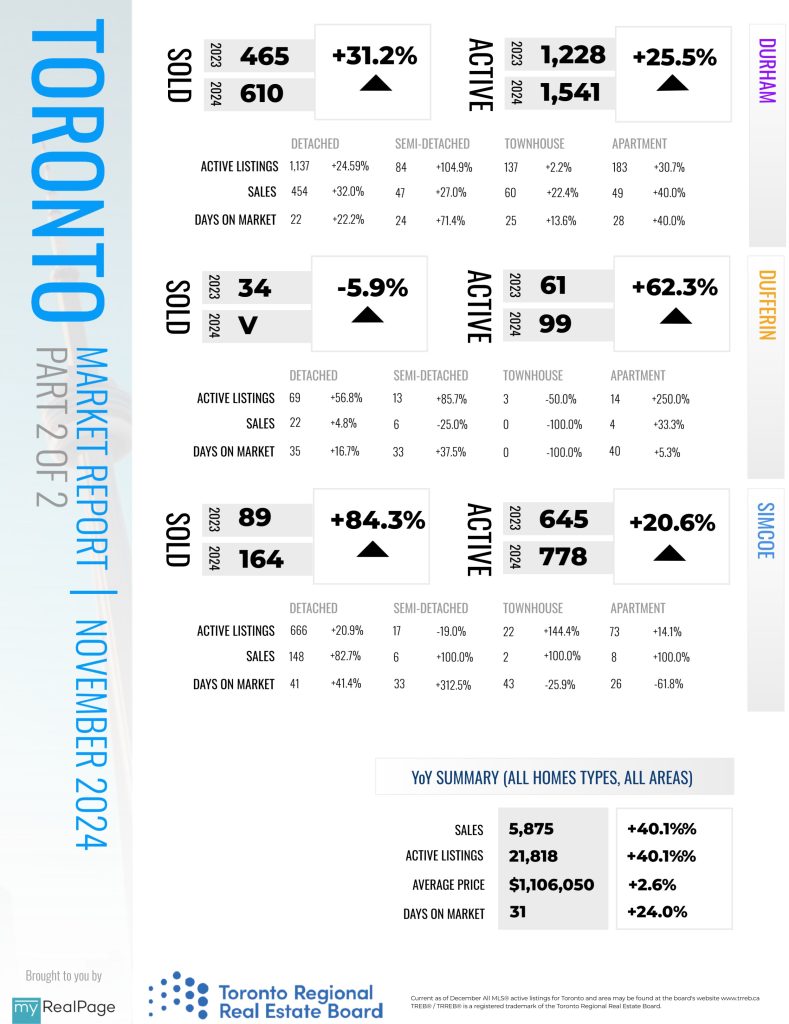
GTA REALTORS® reported 5,875 home sales through TRREB’s MLS® System in November 2024 – up by 40.1 percent compared to 4,194 sales reported in November 2023. New listings entered into the MLS® System amounted to11,592 – up by 6.6 per cent year-over-year. On a seasonally adjusted basis, November sales were up month-over month compared to October.
Read the full report on TRREB website!
The following data is a comparison between November 2024 and November 2023 numbers, and is current as of December 2024. For last month’s numbers, check out our previous infographic!
Or follow this link for all our TREB / TRREB Infographics!
Download Printable Version – November 2024 TRREB, Toronto Market Report
INFOGRAPHICS: October 2024 TRREB Toronto Market Reports

GTA REALTORS® Release October Stats
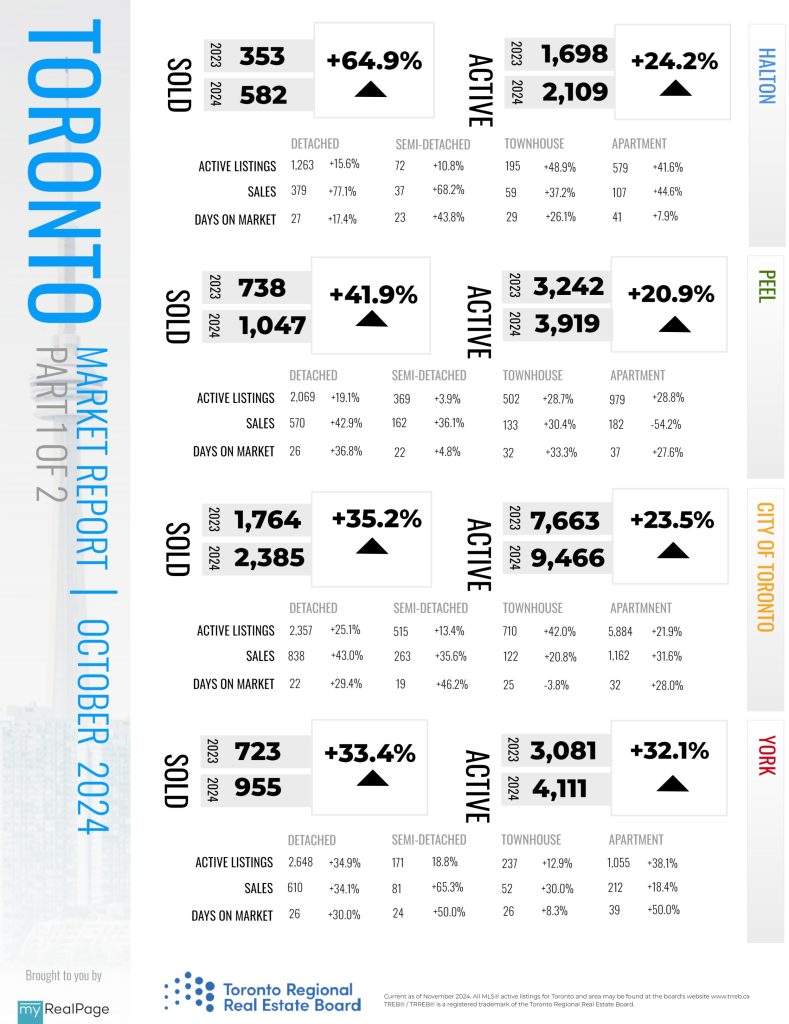
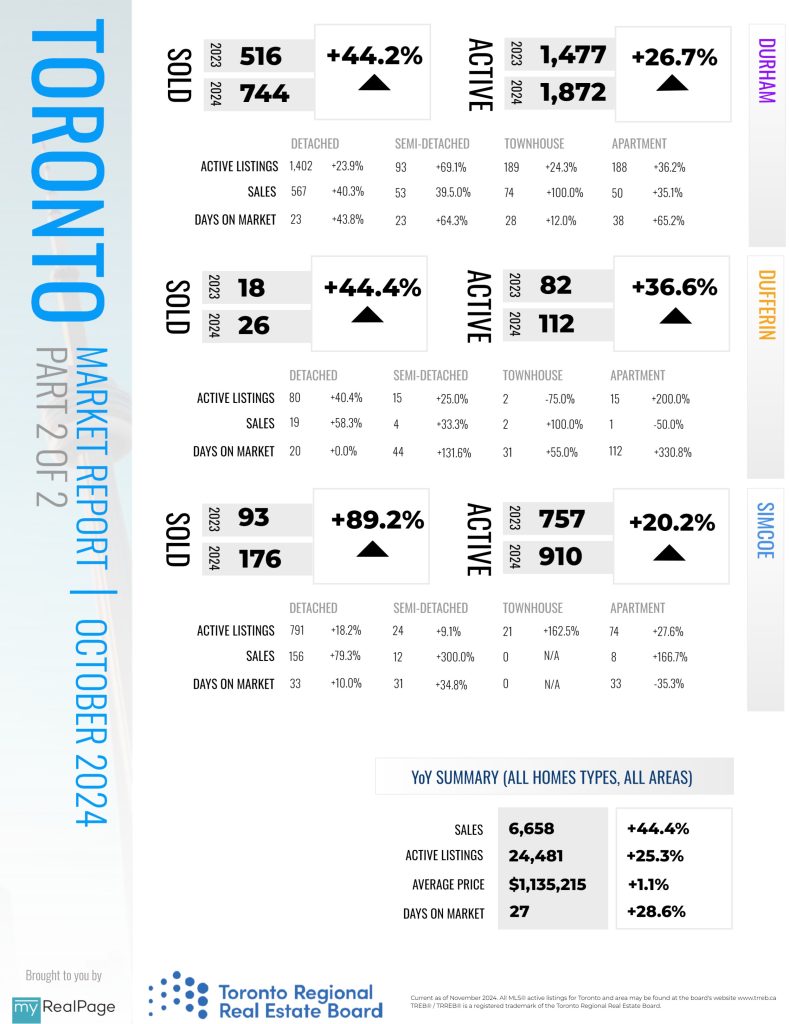
Greater Toronto Area (GTA) home sales increased year-over- year in September. Buyers were starting to take advantage of more affordable market conditions brought about by interest rate cuts and lower home prices.
“As buyers take advantage of changes to mortgage lending guidelines and borrowing costs trend lower, home sales will steadily increase in relation to population growth. With every rate cut, a growing number of GTA households will afford a long-term investment in home ownership, including first-time buyers,” said Toronto Regional Real Estate Board (TRREB) President Jennifer Pearce.
GTA REALTORS® reported 4,996 home sales through TRREB’s MLS® System in September 2024 – up by 8.5 per cent compared to 4,606 sales reported in September 2023. New listings entered into the MLS® System amounted to 18,089 – up by an even greater 10.5 per cent year-over-year. On a seasonally adjusted basis, September sales increased on a monthly basis compared to August, along with new listings.
Read the full report on TRREB website!
The following data is a comparison between October2024 and October 2023 numbers, and is current as of November 2024. For last month’s numbers, check out our previous infographic!
Or follow this link for all our TREB / TRREB Infographics!
Download Printable Version – October 2024 TRREB, Toronto Market Report
INFOGRAPHICS: September 2024 TRREB Toronto Market Reports

GTA REALTORS® Release September Stats
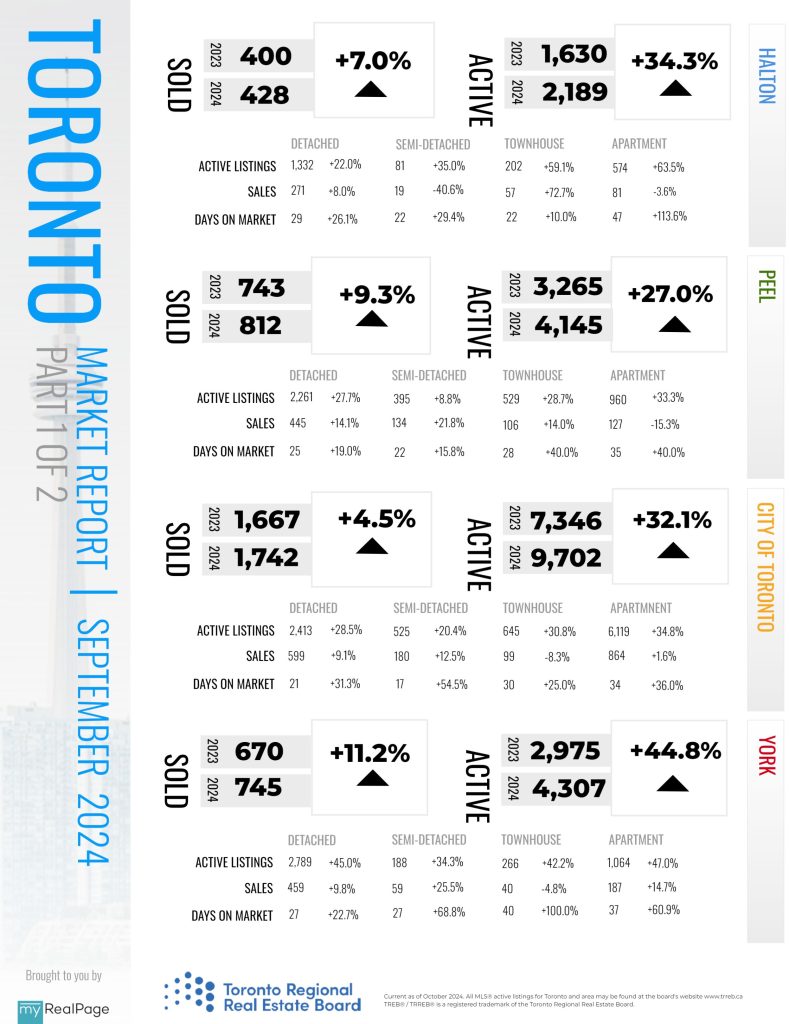
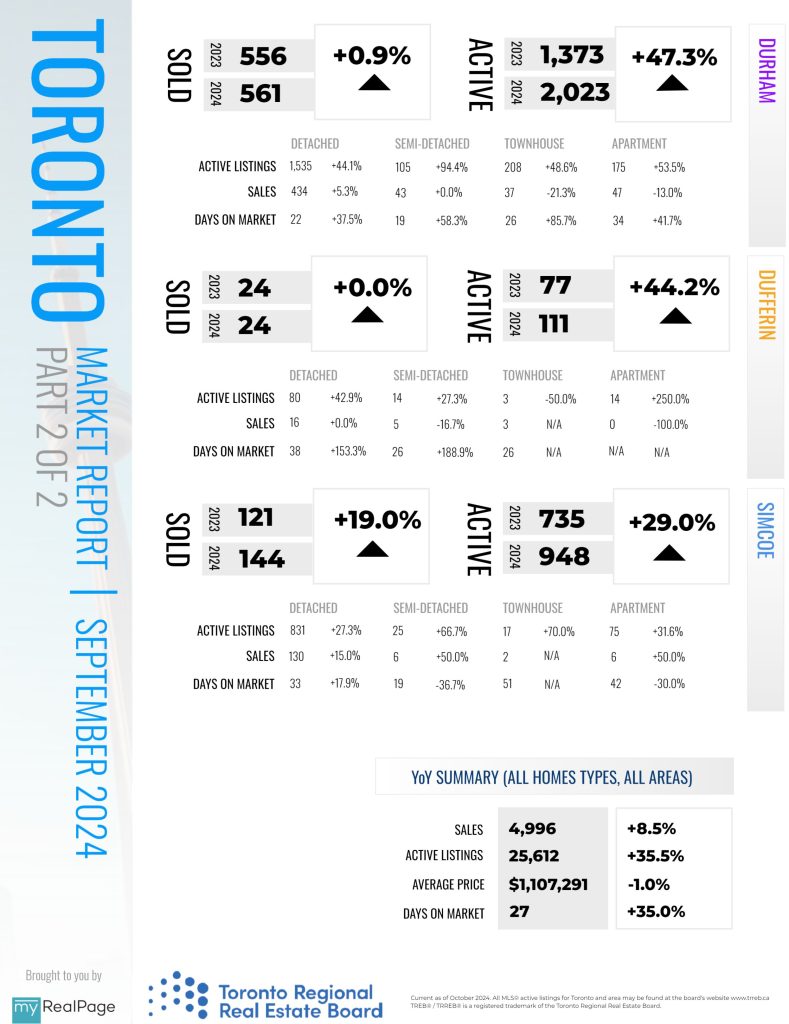
Greater Toronto Area (GTA) home sales increased year-over- year in September. Buyers were starting to take advantage of more affordable market conditions brought about by interest rate cuts and lower home prices.
“As buyers take advantage of changes to mortgage lending guidelines and borrowing costs trend lower, home sales will steadily increase in relation to population growth. With every rate cut, a growing number of GTA households will afford a long-term investment in home ownership, including first-time buyers,” said Toronto Regional Real Estate Board (TRREB) President Jennifer Pearce.
GTA REALTORS® reported 4,996 home sales through TRREB’s MLS® System in September 2024 – up by 8.5 per cent compared to 4,606 sales reported in September 2023. New listings entered into the MLS® System amounted to 18,089 – up by an even greater 10.5 per cent year-over-year. On a seasonally adjusted basis, September sales increased on a monthly basis compared to August, along with new listings.
Read the full report on TRREB website!
The following data is a comparison between September 2024 and September 2023 numbers, and is current as of October 2024. For last month’s numbers, check out our previous infographic!
Or follow this link for all our TREB / TRREB Infographics!
Download Printable Version – September 2024 TRREB, Toronto Market Report
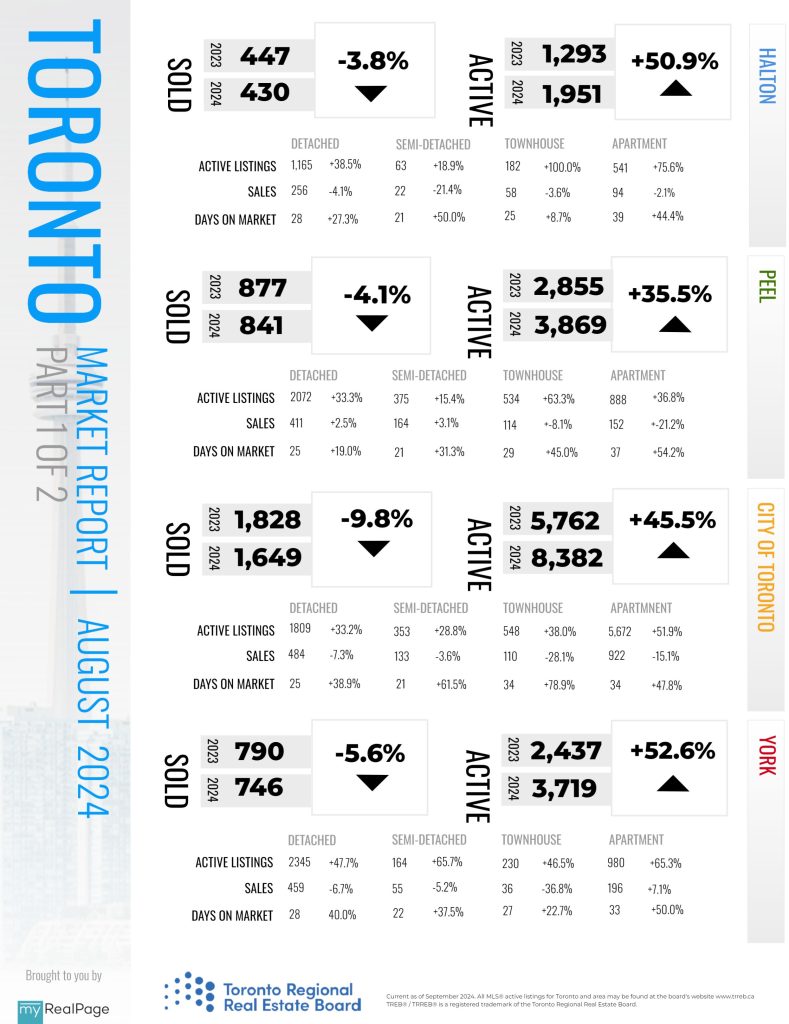
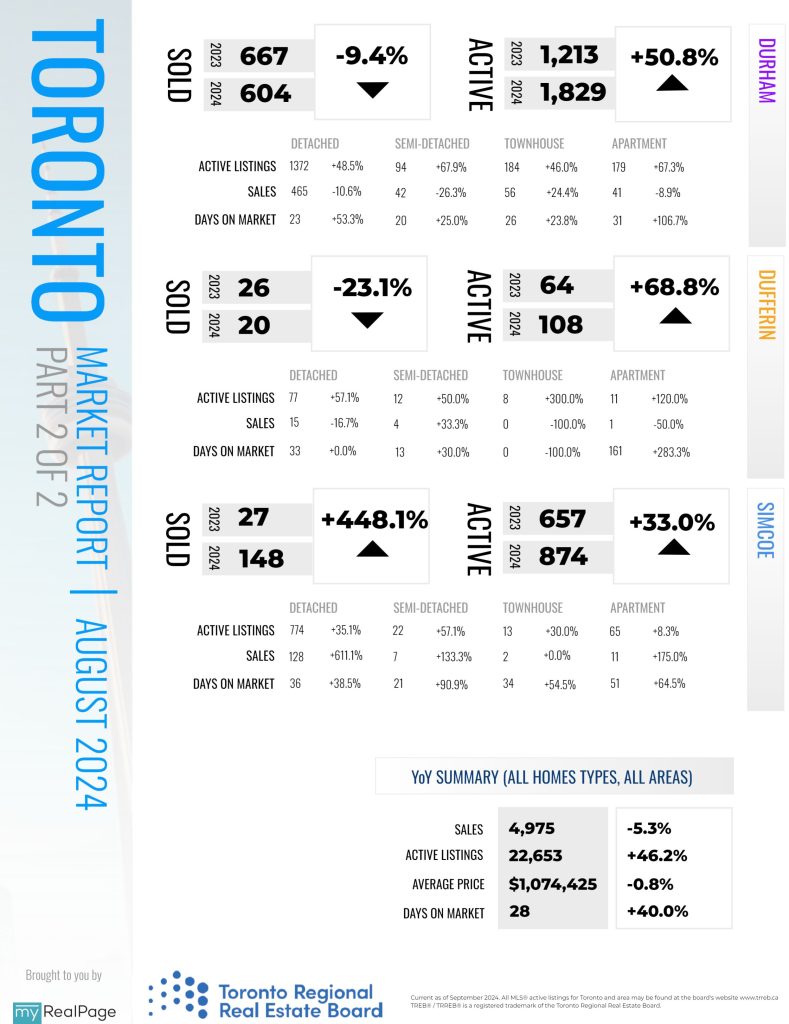
INFOGRAPHICS: August 2024 TRREB Toronto Market Reports

GTA REALTORS® Release August Stats
Greater Toronto Area (GTA) home sales were down on a year- over-year basis in August 2024. New listings were up slightly over the same period. While the region’s housing market remained well-supplied in August, average home prices only edged slightly lower compared to August 2023.
“The Bank of Canada’s rate cut announced on September 4 will lead to a further improvement in affordability, especially for those using variable rate mortgages. First-time buyers are especially sensitive to changes in borrowing costs. As mortgage rates continue to trend lower this year and next, we should experience an uptick in first-time buying activity, including in the condo market,” said Toronto Regional Real Estate Board (TRREB) President Jennifer Pearce.
Read the full report on TRREB website!
The following data is a comparison between August 2024 and August 2023 numbers, and is current as of September 2024. For last month’s numbers, check out our previous infographic!
Or follow this link for all our TREB / TRREB Infographics!
Download Printable Version – August 2024 TRREB, Toronto Market Report
